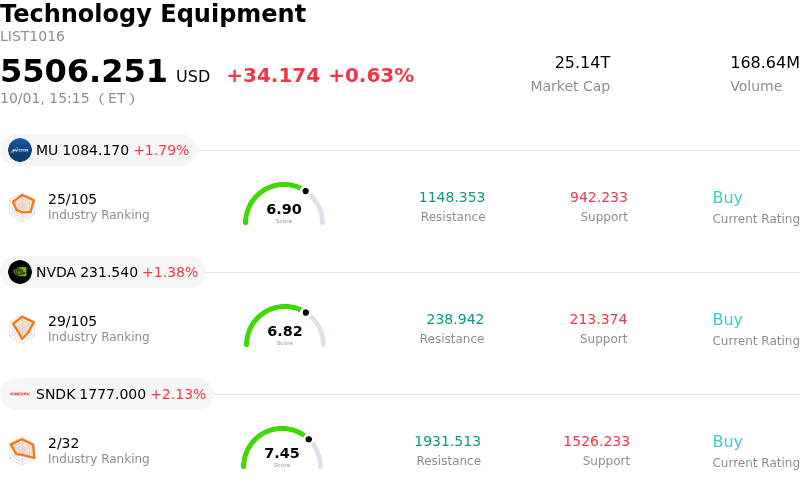
Lam Research Corp (LRCX) moved up by 3.01%. The Technology Equipment sector is up by 0.62%. The company outperformed the industry. Top 3 stocks by turnover in the sector: Micron Technology Inc (MU) up 1.79%; NVIDIA Corp (NVDA) up 1.40%; SanDisk Corporation (SNDK) up 2.13%.
What is driving Lam Research Corp (LRCX)’s stock price up today?
Lam Research experienced an upward move supported by positive industry tailwinds and growing optimism around memory-related capital expenditures. A major catalyst came from major memory chip manufacturers detailing aggressive capital spending plans and strong customer deposit commitments for high-bandwidth memory and advanced memory nodes. As a dominant supplier of etch and deposition equipment critical to memory manufacturing, Lam Research stands as a primary beneficiary of expanding capital outlay across the semiconductor supply chain.
Market sentiment was further boosted by favorable Wall Street research commentary, including price target upgrades from investment firms citing durable equipment demand tied to artificial intelligence infrastructure. Additionally, operational achievements, such as expanding domestic logistics infrastructure to support advanced wafer fabrication tool manufacturing and high-volume deployment, reinforced investor confidence in the company's ability to scale operations efficiently alongside rising global order volumes.
While intraday volatility highlighted ongoing debates regarding the timing of equipment shipments and broader macroeconomic rate uncertainties, the medium-term fundamental picture remains underpinned by structural AI hardware demand. High-bandwidth memory requirements and gate-all-around architectural transitions continue to drive high-margin tool utilization. Institutional investors remain focused on upcoming quarterly order intake figures and customer capital expenditure delivery timelines to validate whether current memory equipment demand will sustain another prolonged expansionary cycle.
Technical Analysis of Lam Research Corp (LRCX)
Technically, Lam Research Corp (LRCX) shows a MACD (12,26,9) value of 11.334, indicating a neutral signal. The RSI at 64.893 suggests neutral condition and the Williams %R at 3.288 suggests overbought condition. Please monitor closely.
Fundamental Analysis of Lam Research Corp (LRCX)
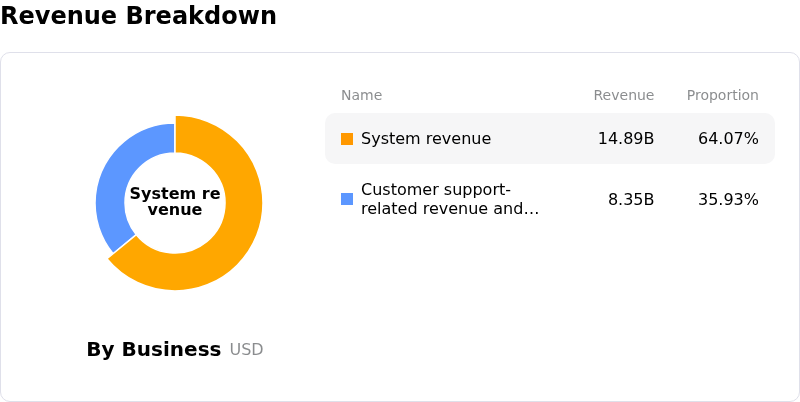
Lam Research Corp (LRCX) is in the Technology Equipment industry. Its latest annual revenue is $23.23B, ranking 12 in the industry. The net profit is $7.27B, ranking 7 in the industry. Company Profile
Over the past month, multiple analysts have rated the company as Buy, with an average price target of $368.88, a high of $500.00, and a low of $213.00.
More details about Lam Research Corp (LRCX)
Company Specific Risks:
- China Revenue Concentration and Geopolitical Trade Controls: High reliance on the Chinese market—representing approximately one-third of total systems revenue—exposes the firm to continuous geopolitical downside from U.S. export restriction enforcement and domestic equipment substitution by Chinese competitors.
- Gross Margin Pressure and Tariff Impacts: Recent financial guidance and analyst commentary highlight near-term gross margin risks caused by unfavorable customer mix shifts, elevated factory operating expenses, and rising tariff-related expenditures.
- Elevated Valuation and AI Spending Velocity Sensitivity: Trading at a notable valuation premium to sector peers leaves the stock susceptible to aggressive intraday sell-offs whenever broader market sentiment cools regarding the pace and timing of AI infrastructure capital expenditures.
- Insider Divestment and Institutional Stake Trimming: Regulatory SEC filings (Form 4 and Form 144) and institutional disclosures show ongoing net insider share liquidation alongside stake reductions by institutional investment funds, burdening near-term trading sentiment.
Find out more